ON THIS PAGE
Climate change is one of the greatest challenges facing our communities, food systems and environment. The United Nation’s Intergovernmental Panel on Climate Change says we only have until 2030 to act to keep global warming to a maximum of 1.50C and cut the risk of extreme heat, drought, floods and poverty for hundreds of millions of people worldwide. In response, governments and business in Canada and around the world have committed to ambitious greenhouse gas (GHG) emissions reductions.
We are committed to doing OurPart™ to take climate action to protect our planet. In fiscal year 2021 we focused on reviewing and understanding all our impacts to see what steps we can take to make the biggest difference. We have been thoughtful in our approach, drawing on the right data to make informed decisions and make plans for continued progress as part of our next-phase sustainability strategy to launch in fiscal year 2023. We’re also committed to keep working with our customers and communities to reduce our impacts.
Our Approach
Over the past three years we’ve focused on reducing our energy use, implementing a range of energy efficiency initiatives including upgrades to refrigeration, lighting and HVAC systems in over 900 stores. This resulted in a 144 million kWh cumulative reduction in electricity use, the equivalent of 34,770 tCO2e.
This program established our strong foundation of action on climate change, which has led us to focus on better understanding all the sources of our GHG emissions. During the past year, we worked with a third-party consultant and quantified our 2019 (baseline) Greenhouse Gas (GHG) emissions to develop our first company-wide carbon inventory. This carbon inventory is a critical first step in our climate change journey, as it highlights the key drivers of our GHG emissions and will inform efforts to reduce our footprint going forward.
The assessment encompassed all grocery and related business banners, both corporate and franchise sites, and Farm Boy (Voilà and Longo’s were not included but will be in future years). The assessment identified material emission sources across all three scopes:
Scope 1
All direct emissions released from operations
Scope 2
Indirect GHG emissions from consumption of purchased energy (e.g. electricity)
Scope 3
Indirect GHG emissions not covered in Scope 2 that occur throughout the supply chain
To develop our 2019 carbon inventory, we began by using the GHG Protocol to define our organizational and operational boundaries and to determine the activities that contribute to each emissions category of Scope 1, 2, 3 emissions. These activities spanned the entire business, including both upstream and downstream activities, as follows:
- Products and packaging: Lifecycle emissions from manufacturing of our products and packaging
- Product transport: Vehicle emissions from Sobeys’ corporate fleet and third-party logistics providers
- Buildings and operations: Natural gas, electricity and refrigerant releases from corporate and franchise sites
- Other Scope 3 emissions including:
- Lifecycle emissions from capital goods and construction activities
- Waste produced at our sites
- Emissions from the production of natural gas and electricity
- Use of fuel sold at our gas stations
- Business travel and employee commuting
We then identified the systems and teams throughout our business that could provide the required data and insight on each activity listed above. We engaged with representatives from real estate, finance, supply chain, strategic sourcing, human resources, Own Brands, wholesale, related business, and others. In addition to functional representatives, we connected directly with specific banners to ensure the business functions included in the inventory scope were represented in the data collected.
Together with the representatives from each team, we analyzed the data provided and performed extrapolation where necessary to enhance data coverage. Upon finalizing the data, we calculated our emissions using updated emission factors for electricity and various fuel types, as well as the GHG Protocol’s Scope 3 Evaluator Tool to estimate emissions based on expenditure data for Scope 3 emissions sources.
This assessment resulted in a detailed baseline of our GHG emissions for the 2019 calendar year along with an inventory of the sources of our emissions.
| GHG Emissions* |
Total GHG Emissions |
Total Scope 1 Emissions |
Total Scope 2 Emissions |
Total Scope 3 Emissions |
Combined Scope 1 and 2 Emissions per unit of square foot |
|---|---|---|---|---|---|
| 2019 (baseline) | 23,678,091 tCO2e | 396,685 tCO2e | 354,893 tCO2e | 22,926,514 tCO2e | 33.73 kgCO2e/sqft |
GHG Emissions*
Total GHG Emissions
2019 (baseline)
23,678,091 tCO<sub>2</sub>e
GHG Emissions*
Total Scope 1 Emissions
2019 (baseline)
396,685 tCO<sub>2</sub>e
GHG Emissions*
Total Scope 2 Emissions
2019 (baseline)
354,893 tCO<sub>2</sub>e
GHG Emissions*
Total Scope 3 Emissions
2019 (baseline)
22,926,514 tCO<sub>2</sub>e
GHG Emissions*
Combined Scope 1 and 2 Emissions per unit of square foot
2019 (baseline)
33.73 kgCO<sub>2</sub>e/sqft
Please Note:
1. 2019 GHG inventory includes all Sobeys Inc and Empire grocery and related business banners in operation in 2019, including corporate and franchise sites and Farm Boy. This does not include emissions from Voila and Longo’s since they were not part of our operations in 2019.
2. Scope 1 emissions sources encompass natural gas, propane and fuel oil used for heating and store operations, as well as refrigerant emissions, fuel from corporate fleet and diesel in onsite generators.
3. Scope 1 emissions from refrigerant leakage includes our corporate grocery sites where maintenance service providers are integrated with our maintenance tracking and data management system. We will be enhancing our data collection processes over the next year as we continue to work with our service providers to expand coverage of this emissions source.
4. Scope 2 emissions source encompasses electricity consumption.
5. Scope 3 emissions sources encompass purchased goods & services, capital goods, fuel and energy related activities (not included in Scope 1 or 2), upstream transportation and distribution, waste generated in operations, business travel, employee commuting, use of sold products, and franchises.
Where our GHG Emissions Come From
It is critical that we understand where we are generating GHG emissions across our operations so we can focus our efforts on the opportunities with the biggest reduction potential. Our GHG assessment revealed that our biggest source of emissions comes from manufacturing the products and packaging in our supply chain (Scope 3), which is typical for the grocery industry. Of the GHG emissions that we directly control (Scope 1 and 2), our biggest GHG emission sources are from our retail store buildings and transportation.

17,412 kt

Products & Packaging
This emissions source covers the lifecycle emissions related to manufacturing of products sold at Sobeys’ corporate stores and franchisees.

217 kt

Product Transport
Transportation emissions caused by the fuel consumption of Sobeys’ truck fleet*, corporate passenger car fleet and contracted third-party logistics service providers during movement of product.

975 kt

Buildings & Operations
Use of fuel, electric power, and refrigerant release at Sobeys’ corporate stores, RSC, offices (Scope 1 and 2), and franchisees (Scope 3).

5,024 kt

Other Scope 3 Emissions
Other Upstream Scope 3 emissions include use of sold products, capital goods purchased, upstream emissions from production of fuel and electricity, and emissions from waste generated.

50 Kt

Other Travel
This covers Scope 3 emissions from business travel and employees commuting to work.
+All units are in kilo tCO2e (tonnes of carbon dioxide equivalent)
*Scope 1 emissions related to transportation estimated based on fuel spending provided and average 2019 diesel price published by Natural Resource Canada.
The results of this assessment are helping to shape our next-phase sustainability strategy, which is in-development in fiscal year 2022. Our plan is to set a bold target to address climate change in fiscal year 2022 and do our part to make a meaningful contribution to this immense global challenge.


How We’re Making a Difference
Using Energy Sustainably
In recent years we’ve put in place several industry best practices across all banners to improve energy management so we can reduce energy consumption in our stores, including:
|
Fiscal Year 2019 Key Accomplishments |
Fiscal Year 2020 Key Accomplishments |
Fiscal Year 2021 Key Accomplishments |
|||
|---|---|---|---|---|---|
| Fiscal Year 2019 Key Accomplishments | Retrofitted overhead lighting for 15 million square feet of stores and distribution centres (25% of fleet). | Fiscal Year 2020 Key Accomplishments | Retrofitted overhead lighting at 400 locations. | Fiscal Year 2021 Key Accomplishments | Retrofitted overhead lighting at 200 locations. |
| Fiscal Year 2019 Key Accomplishments | Tested 16 initiatives across 16 pilot stores to identify initiatives for full implementation in fiscal 2020 and fiscal 2021. | Fiscal Year 2020 Key Accomplishments | Retrofitted case lighting at 500 locations. | Fiscal Year 2021 Key Accomplishments | Retrofitted Case lighting at 134 locations. |
| Fiscal Year 2019 Key Accomplishments | Reprogrammed lighting hours at over 400 locations. | Fiscal Year 2020 Key Accomplishments | Recommission refrigeration and HVAC systems at 200 locations. | Fiscal Year 2021 Key Accomplishments | Installed SMC fan motors in 88 locations. |
| Fiscal Year 2019 Key Accomplishments | Implemented Basic Dashboard to track and benchmark energy usage (kWh/sqft). | Fiscal Year 2020 Key Accomplishments | Retrofit “Back of House” systems at over 500 locations. | Fiscal Year 2021 Key Accomplishments | Installed Digital Discus compressors at 105 locations. |
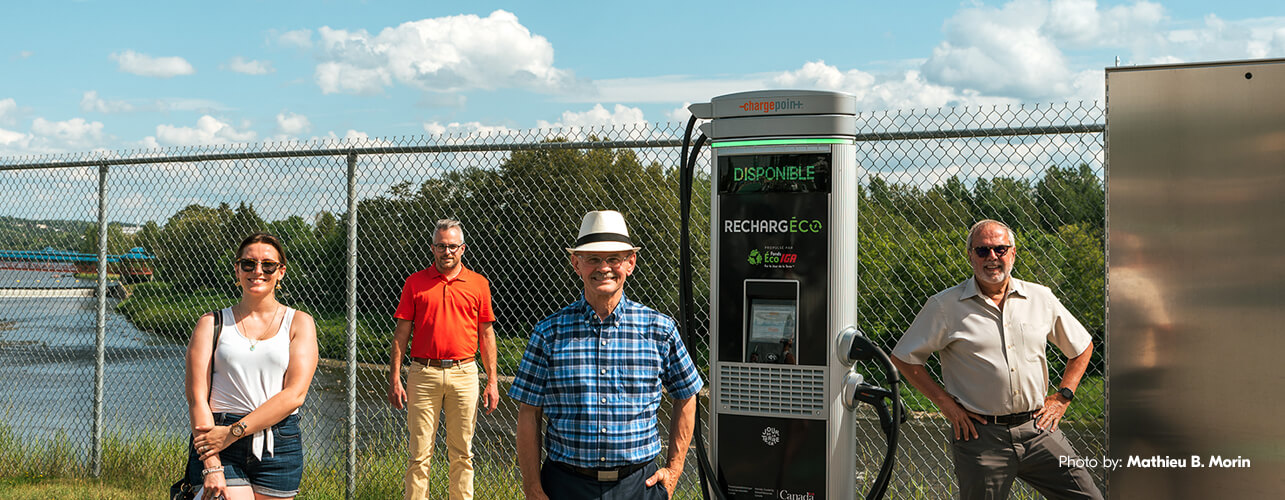
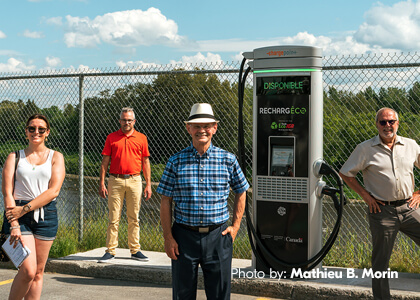
We’re also proud to partner with Earth Day Canada and Natural Resources Canada to install 100 Level-3 fast-charging stations in the parking lots of 50 IGA grocery stores across Québec and New Brunswick by autumn 2021. Our customers will be able to charge their vehicles in just 20 minutes — the time it takes to shop for groceries. To help power our communities as well as their cars, proceeds from the charging stations will be donated to a local community organization in each of the 50 municipalities where they have been installed.
Climate Action in Our Communities
As part of our commitment to phase out single-use plastic grocery bags, we’re also taking steps to reduce the impacts of the paper bags sold in our stores. We donate to the international charity One Tree Planted, which uses that funding to offset carbon in the atmosphere by planting trees. With our support, the group plant 14,000 trees in Nova Scotia, reforesting 27 acres of former agriculture land with local tree species carefully chosen with biodiversity, climate stability and the surrounding community in mind. Our partnership with One Tree Planted continues in British Columbia, Ontario and Québec.

Our work on climate action connects with our focus on reducing plastics and food waste.


